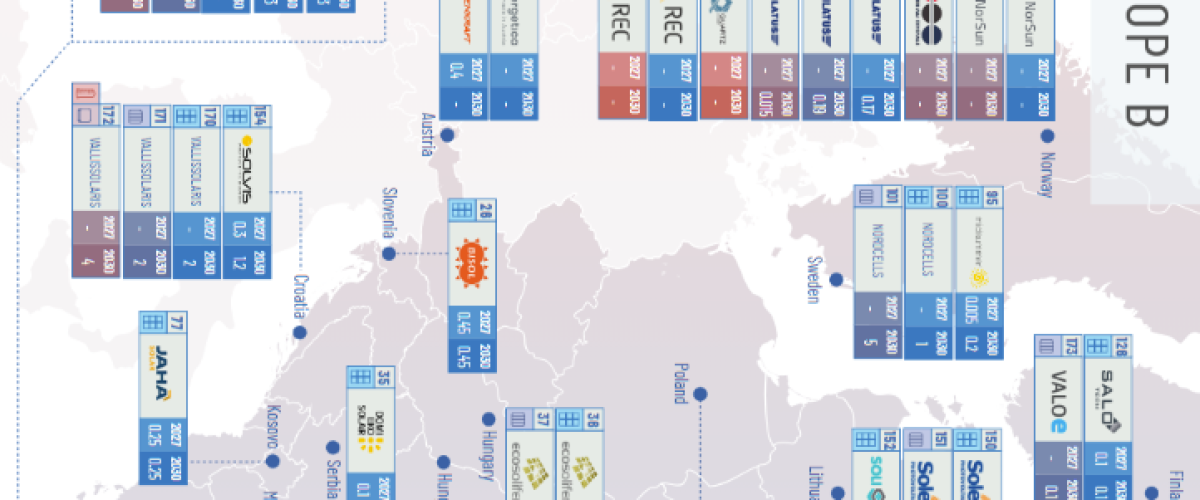
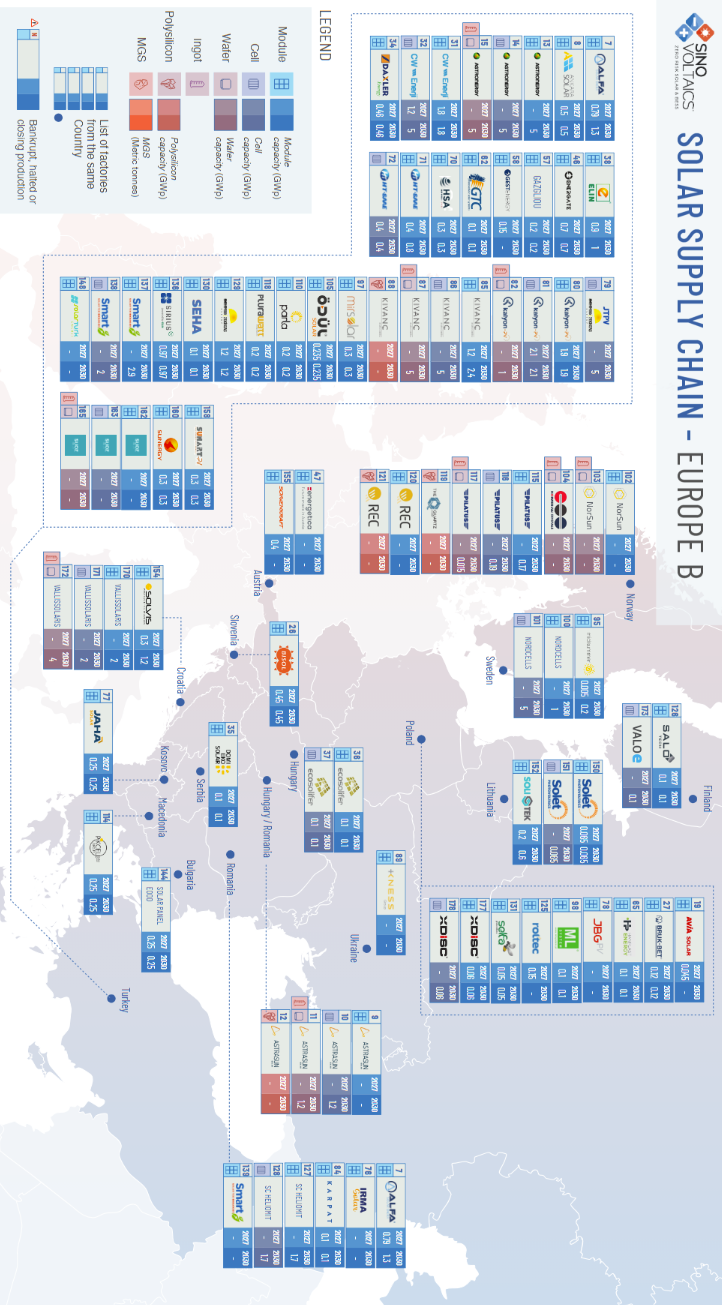
Sinovoltaics publishes a European PV supply chain map that plots every operating and planned module plant in Europe, together with the cell, wafer, ingot, polysilicon and metallurgical-grade silicon suppliers behind them — 178 numbered entries with current capacity and a 2030 target, updated every four months.
The 2026 first edition is worth reading for three reasons, and one of them is the change since the last version.
1. The base is larger than expected — and mostly unbuilt
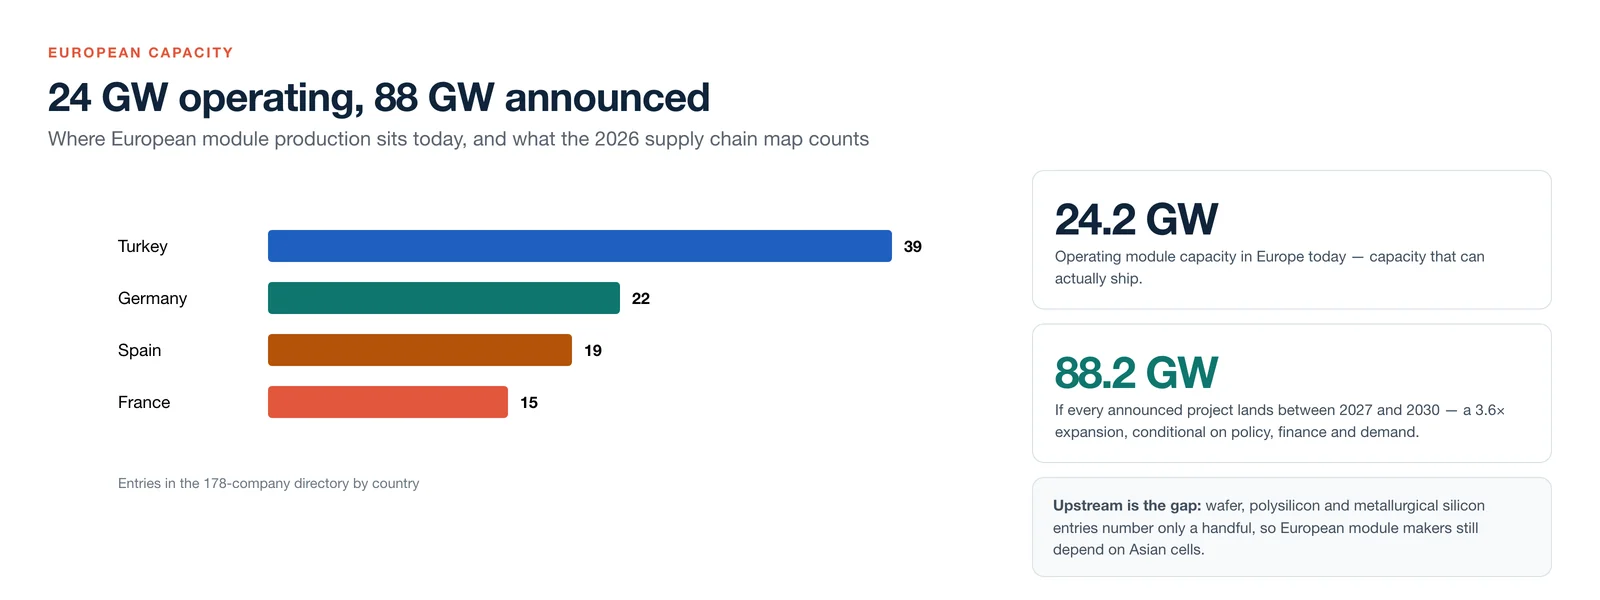
Europe operates about 24.2 GW of module capacity today. If every announced project is completed between 2027 and 2030, the total would reach 88.2 GW — a 3.6-fold expansion. The distinction matters: 24.2 GW can ship, 88.2 GW is a plan that depends on policy, finance and demand.
2. Capacity is stuck at modules; upstream is scarce
Module plants are numerous but small, mostly 0.1–2 GW each. Move upstream and the list collapses: only a handful of wafer, polysilicon and metallurgical silicon suppliers remain. The further up the chain you go, the more the continent depends on a few companies — which is why European module makers still rely on Asian cells.
3. Turkey is Europe's largest module producer
By number of entries Turkey leads with about 39, ahead of Germany (22), Spain (19) and France (15). Whether Turkey counts toward "European local content" is a question buyers and regulators have to answer explicitly before using this map in a procurement decision.
| Segment | Situation |
|---|---|
| Module assembly | 24.2 GW operating, spread across many small plants typically 0.1–2 GW each |
| Announced pipeline | 88.2 GW if every announced project lands between 2027 and 2030 |
| Upstream | A handful of wafer, polysilicon and metallurgical silicon suppliers — SunWafe, MCPV, Wacker, PCC among them |
| Geography | Turkey has the most entries (39), then Germany (22), Spain (19), France (15) |
| Narrative | The previous edition was dominated by closures and insolvency; this one by expansion and new builds |
The signal in the change
The most useful observation is comparative. The previous edition told a story of closures and bankruptcies; this one is about expansion and new plants. That reversal is itself the industry signal — with the caveat that the 88.2 GW on the map still has to survive three tests: policy support, financing cost and actual demand. Read it as a scenario, and track it by probability rather than as a forecast.
How ZOEAST PV reads it
For a supplier outside Europe, this map is a map of customers and competitors at once. ZOEAST PV exports cells, modules and storage systems to Europe from Yixing, and we use this kind of capacity data for two practical purposes: understanding which European assemblers are genuinely operating and might buy cells, and knowing where module capacity is being built so that our own quoting reflects reality rather than announcements.
If you are assessing European sourcing or local-content requirements for a project, talk to our team; our cell and module ranges are on the cell and module pages.
Source: Sinovoltaics, European PV Supply Chain Map, 2026 edition (1st release), as summarised in the original Chinese article. Capacity figures are the map's own operating and announced totals; the 88.2 GW figure is a scenario, not a forecast. Figures: ZOEAST PV, redrawn in English; map reproduced from the source.